- Buy Crypto
- Markets
 Futures
- Spot
- Copy Trade
 Earn
Earn- More
On-chain Data Academy (Part Seven): A Brand New, Ark-involved $BTC Magical Pricing Methodology (II)
Original Article Title: "On-Chain Data Classroom (VII): A Brand New Set, Ark Participated Research on the Magical Pricing Methodology of $BTC (II)"
Original Article Author: Mr. Berg, On-Chain Data Analyst
If you are not familiar with Cointime Price yet, it is recommended to read the first article: "On-Chain Data Classroom (VI): A Brand New Set, Ark Participated Research on BTC's Magical Pricing Methodology (I)"
TLDR
- The Cointime Price series consists of three articles, this being the second article
- This article will introduce the application method of Cointime Price in top avoidance
- This article will introduce a personally designed deviation model
1. Brief Review of Cointime Price
The concept of Cointime Price originates from Cointime Economics, which evaluates BTC's fair price in a "time-weighted" manner.
Compared to simply Long-Term Holders (LTH) and Short-Term Holders (STH), Cointime Price is more elastic, sensitive, and can effectively exclude the influence of ancient lost BTC.
The first article detailed Cointime Price and its buy-the-dip application. If you already understand the concept, let's officially delve into today's topic: top avoidance application
2. Top Avoidance Application Methodology: Cointime Price Deviation Model Design
Cointime Price Deviation is one of the models I designed during my on-chain data research and has been applied in the weekly top avoidance analysis report.
Related Tweet: [Top Avoidance Model Introduction](https://x.com/market_beggar/status/1870763628645032213)
The following text will explain the model's design principles and how to use the model to assess BTC tops. All content in this article is original research, the research process is not easy, so please show your support
1. Quantifying Current Price Deviation from Cointime Price
Why Measure Deviation?
- The Cointime Price highly represents the true holding cost of BTC chips, especially for Long-Term Holders (LTH).
- Since Long-Term Holders have a greater impact on the Cointime Price, when the BTC current price is significantly higher than the Cointime Price, the profit-taking motivation of Long-Term Holders increases, which may trigger distribution behavior.
· Calculation Formula: Deviation Rate = (Current Price - Cointime Price) / Current Price
· Observing Deviation Rate (Distribution Rate)
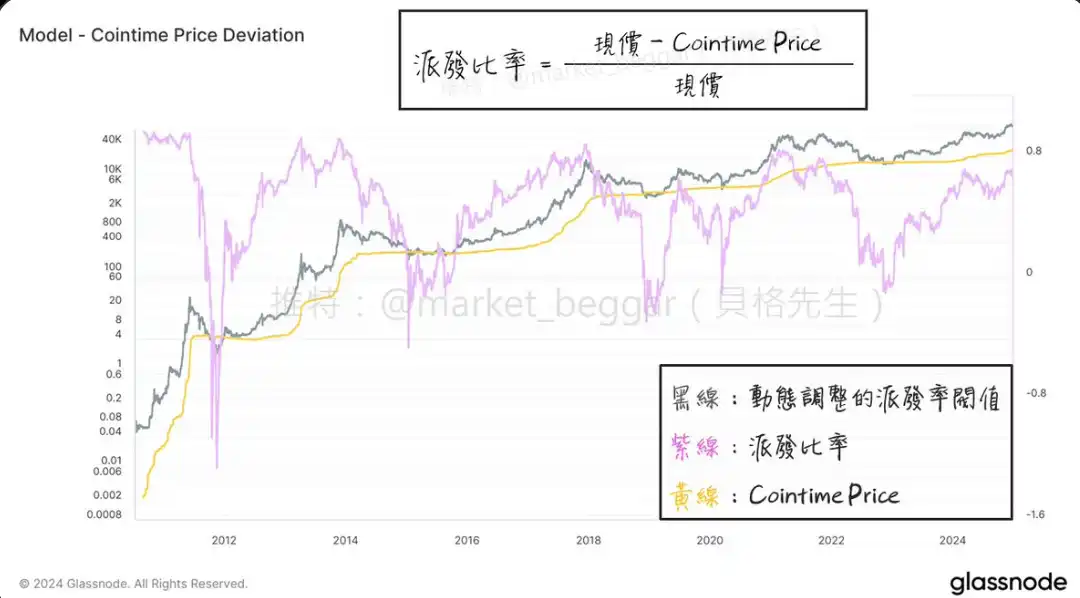
As shown in the chart, we can obtain the Distribution Rate curve (purple line). We can see that: whenever the Distribution Rate is at a high level, it often corresponds to the BTC top.
So, how do we define a "high level"? Next, we will use statistical methods to address this issue.
2. Cointime Price Deviation Extreme Value Definition
If we observe historical data, we will find that the high points of Deviation are not fixed; in each bull market cycle, the peak value of Deviation slightly decreases. Therefore, it is not rigorous to solely use a fixed numerical value to define a "high level."
To address this, I adopt the concept of statistical "standard deviation":
· Calculate the mean and standard deviation of historical Deviation data.
· Define "Mean + n standard deviations" as the "high level (top signal)," referred to as the Threshold.
· Smooth the Deviation data with a moving average to reduce noise.
· When the moving average value of Deviation> Threshold, trigger a top signal.
· Why Use Standard Deviation?
· The historical trend of Deviation exhibits mean reversion characteristics (as shown in the chart).
· Standard deviation measures volatility, so when BTC price volatility decreases, the Threshold will also dynamically adjust, providing more elasticity.

As shown in the above diagram, after the above processing, we can get such a diagram.
· Supplementary Explanation
- In point 2, "Mean + n Standard Deviations," n is an adjustable parameter: the larger n is, the lower the probability of vertex signal occurrence, and the model is more stringent.
- Point 3's moving average smoothing: mainly filters out short-term market fluctuations to improve signal reliability.

3. Top Escaping Signal Example
As shown in the figure, when the purple line (Distribution Ratio) exceeds the orange line (Threshold), the corresponding BTC price is often at a phase top.
III. Conclusion
This article is the second in the Cointime Price series, continuing the concepts of the previous article, sharing how individuals can design a top escaping model using Cointime Price.
· Summarize Core Points:
- Cointime Price Deviation quantifies the deviation of the current BTC price from the Cointime Price, speculating on the distribution motivation of long-term holders, used to determine the BTC top.
- The "Standard Deviation" method is used to dynamically define top signals to ensure the model is more adaptive.
- The model has been practically applied in weekly reports and can effectively capture BTC high-level signals.
Future Plans:
- The third article in this series will continue to explore the application of Cointime Price in escaping the top, so stay tuned.
You may also like
Why Bitcoin Is Falling Now: The Real Reasons Behind BTC's Crash & WEEX's Smart Profit Playbook
Bitcoin's ongoing crash explained: Discover the 5 hidden triggers behind BTC's plunge & how WEEX's Auto Earn and Trade to Earn strategies help traders profit from crypto market volatility.

Wall Street's Hottest Trades See Exodus

Vitalik Discusses Ethereum Scaling Path, Circle Announces Partnership with Polymarket, What's the Overseas Crypto Community Talking About Today?

Believing in the Capital Markets - The Essence and Core Value of Cryptocurrency

Polymarket's 'Weatherman': Predict Temperature, Win Million-Dollar Payout

$15K+ Profits: The 4 AI Trading Secrets WEEX Hackathon Prelim Winners Used to Dominate Volatile Crypto Markets
How WEEX Hackathon's top AI trading strategies made $15K+ in crypto markets: 4 proven rules for ETH/BTC trading, market structure analysis, and risk management in volatile conditions.

A nearly 20% one-day plunge, how long has it been since you last saw a $60,000 Bitcoin?

Raoul Pal: I've seen every single panic, and they are never the end.

Key Market Information Discrepancy on February 6th - A Must-Read! | Alpha Morning Report

2026 Crypto Industry's First Snowfall

The Harsh Reality Behind the $26 Billion Crypto Liquidation: Liquidity Is Killing the Market
Why Is Gold, US Stocks, Bitcoin All Falling?

Key Market Intelligence for February 5th, how much did you miss out on?

Wintermute: By 2026, crypto had gradually become the settlement layer of the Internet economy
Tether Q4 2025 Report: USDT Market Cap Nears $190 Billion, Multiple Metrics Reach All-Time Highs

Kyle Samani's about-face, one of the biggest believers in web3, has also left the industry

Bhutan Quietly Sells Over $22M in Bitcoin, Drawing Speculation Over Possible Moves
Key Takeaways Bhutan has transferred over $22 million in Bitcoin from sovereign wallets in the past week. The…
BitMine Endures a $7B Unrealized Loss as Ethereum Dips Below $2,100
Key Takeaways BitMine is facing a significant financial challenge with an unrealized loss of over $7 billion in…
Why Bitcoin Is Falling Now: The Real Reasons Behind BTC's Crash & WEEX's Smart Profit Playbook
Bitcoin's ongoing crash explained: Discover the 5 hidden triggers behind BTC's plunge & how WEEX's Auto Earn and Trade to Earn strategies help traders profit from crypto market volatility.
Wall Street's Hottest Trades See Exodus
Vitalik Discusses Ethereum Scaling Path, Circle Announces Partnership with Polymarket, What's the Overseas Crypto Community Talking About Today?
Believing in the Capital Markets - The Essence and Core Value of Cryptocurrency
Polymarket's 'Weatherman': Predict Temperature, Win Million-Dollar Payout
$15K+ Profits: The 4 AI Trading Secrets WEEX Hackathon Prelim Winners Used to Dominate Volatile Crypto Markets
How WEEX Hackathon's top AI trading strategies made $15K+ in crypto markets: 4 proven rules for ETH/BTC trading, market structure analysis, and risk management in volatile conditions.